Local Business (UKSPF) Data about Local Business covers information about the business landscape in the North East, including business births and deaths rates, scale-ups, high-growth firms, sectoral analysis, the job market, international trade, and innovation. The North East LEP has a low number of businesses per head and deaths rates limits the potential for private sector growth in Q4 of 2021, but overall exports in 2021 were below 2019 levels North East businesses are finding it difficult to recruit staff but low levels of R&D spend and patents granted in the North East About this investment themeThe focus for this investment theme is to: - Create jobs and boost community cohesion, through investments that build on existing industries and institutions, and range from support for starting businesses to visible improvements to local retail, hospitality, and leisure sector facilities.
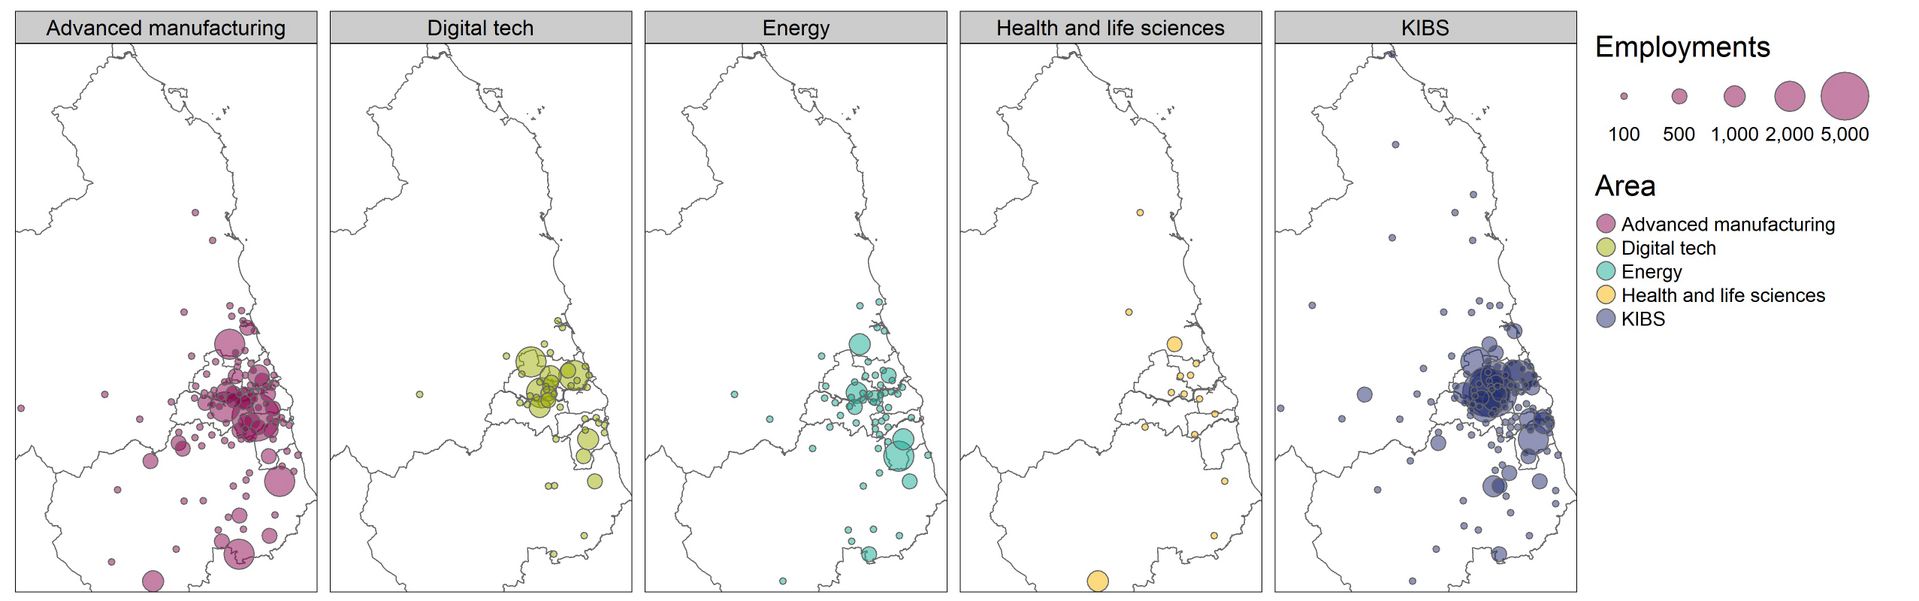
- Promote networking and collaboration through interventions that bring together businesses and partners within and across sectors to share knowledge, expertise and resources, and stimulate innovation and growth.
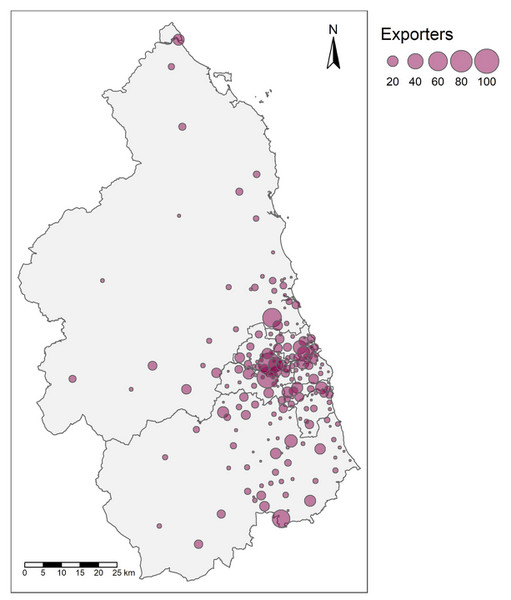
- Increase private sector investment in growth-enhancing activities, through targeted support for small and medium-sized businesses to undertake new-to-firm innovation, adopt productivity-enhancing (energy efficient and low carbon) technologies, and start or grow their exports.
Business baseThe North East LEP has a low number of businesses per head reflecting the small size of the private sector in the region. Over 99% of private sector enterprises in the North East LEP are SMEs (a similar share to nationally), and the North East has more sole proprietors than elsewhere in the UK. Private sector enterprises per 10,000 adult population, North East local authoritiesSource: UK Business Counts (ONS via Nomis) (last updated 2023, next update autumn 2024) Data information: Annual count of enterprises registered for VAT and/or PAYE, taken in March. Enterprises are defined as the smallest combination of legal units (generally based on VAT or PAYE records) that have a certain degree of autonomy within an enterprise group.
Based on England excluding London, England, LEP areas and local authority areas.
Read MorePrivate sector enterprises per 10,000 adult population, North East constituenciesSource: UK Business Counts (ONS via Nomis) (last updated 28 Sep 2022, next update autumn 2023) Data information: Annual count of enterprises registered for VAT and/or PAYE, taken in March. Enterprises are defined as the smallest combination of legal units (generally based on VAT or PAYE records) that have a certain degree of autonomy within an enterprise group.
Based on North East parliamentary constituencies.
Adult population is defined as aged 16 and over.
Read MoreCompanies by employment size band per 10,000 adult population, Core city LEP areasSource: UK Business Counts (Nomis, last updated 4 Oct 2021), mid year population estimates (Nomis, last updated 25 Jun 2021) Data information: Based on core city LEPs, England excluding London and England - Annual count of enterprises registered for VAT and/or PAYE, taken in March 2021
- Enterprises are defined as the smallest combination of legal units (generally based on VAT or PAYE records) that have a certain degree of autonomy within an enterprise group
- Adult population is defined as aged 16 and over
- Companies include building societies
Read More
Business births and deathsThe North East LEP area has consistently low business births and deaths rates, limiting the for potential private sector growth. Newcastle, Sunderland and Gateshead have the highest business birth rates in the LEP, while the other authorities are below the LEP average. The North East LEP has the lowest business birth rate within the Core Cities. Business births and deaths per 10,000 adults since 2014Data information: North East LEP calculations using ONS midyear population estimates. Adults defined as 16+ - There were 43 business births per 10,000 adults in the North East LEP area in 2020, compared to 60 for England excluding London. Both areas had very similar birth rates to 2014.
- If the North East LEP had the same rate of business births as England excluding London there would be an additional 2,800 businesses started each year.
- There were 43 business deaths in the North East LEP area in 2020, compared to 53 in England excluding London. Research suggests business birth and death rates are closely correlated.
Read MoreBusiness births and deaths per 10,000 adults (2020)Source: Business demography (ONS, last updated 17 November 2020) Data information: Based on local authority areas, North East LEP and England excluding London
Read MoreBusiness birth and death rates, North East LEP, England, core city LEPsSource: Business demography (ONS, last updated 17 November 2020) Data information: Based on the North East LEP area, core city LEP areas, England excluding London and England
Read More
Scale-upsScale-up rates for new and existing enterprises in the North East are relatively similar to most of the other Core Cities.
High-growth firmsHigh growth rates in the North East LEP are comparable to many of the Core Cities, with high growth firms being most common in Newcastle, Sunderland, Gateshead and North Tyneside. The North East LEP has also been adding new scale-ups at a quicker rate than the rest of the Core Cities since 2013. Proportion of high growth firms between 2017-2020 (Core Cities)
Read MoreProportion of high growth firms between 2017-2020 (North East LEP)
Read MoreAdditional high growth firms per 100k population, Core Cities, 2013-2018
Read More
Sectoral analysisThe North East LEP has identified five areas of strategic importance where the North East has a competitive advantage and there is significant potential for future regional growth. These five areas are advanced manufacturing, digital tech, energy, health and life sciences and knowledge intensive business services (KIBS). Employment in the areas of strategic importance in distributed across the North East LEP, with local clusters in all authorities. All local authorities in the North East LEP have a specialisation in at least one of the five areas of strategic importance. Durham has the most employments in advanced manufacturing, whilst Sunderland the most in motor vehicles manufacturing. Pharmaceutical manufacturing is concentrated in Durham and Northumberland, with MedTech in Sunderland and Newcastle. Sunderland has the most employments in energy, most of which are in gas and electricity production and trade. Newcastle has the most employments in software development and computing, while North Tyneside has more in digital telecoms. Knowledge intensive business services are concentrated in Newcastle, with large financial, software and legal subsectors Advanced manufacturing - Employments by Local Authority and subsector (2020)Data information: Data is for the North East LEP area by each of seven Local Authorities within the LEP's boundaries. Employments includes employees plus the number of working owners. The BRES therefore includes self-employed workers as long as they are registered for VAT or Pay-As-You-Earn (PAYE) schemes. Self employed people not registered for these, along with HM Forces and Government Supported trainees, are excluded. Employments in the advanced manufacturing area have been defined using 5 digit SIC codes selected by the North East LEP. Subsector totals may not sum correctly due to rounding. - Overall there were 64,000 employments in advanced manufacturing in the North East LEP area in 2020.
- The local authorities with the highest number of individuals employed in this area were County Durham and Sunderland, containing 18,000 and 16,000 employments.
- Of those employed in advanced manufacturing in Sunderland, 10,000 were employed in motor vehicle manufacturing.
- The biggest single subsectors in County Durham were metals and plastics (5000 and 2250 employments).
- County Durham and Northumberland have the largest numbers employed in pharmaceutical and medicinal manufacturing, 1,500 and 1,250 employments respectively.
Read MoreHealth and life sciences - Employments by Local Authority and subsector (2020)Data information: Data is for the North East LEP area by each of seven Local Authorities within the LEP's boundaries. Employments include employees plus the number of working owners. The BRES therefore includes self-employed workers as long as they are registered for VAT or Pay-As-You-Earn (PAYE) schemes. Self employed people not registered for these, along with HM Forces and Government Supported trainees, are excluded. Employments in the health and life sciences area have been defined using 5 digit SIC codes selected by the North East LEP. Subsector totals may not sum correctly due to rounding. - Overall there were 5,000 employments in health and life sciences in the North East LEP area in 2020
- 2,000 of these employments were located in County Durham and a further 1,500 were located in Northumberland
- Most of the heath and life sciences employment in Northumberland and County Durham was in pharmaceutical and medical manufacturing (82% and 70% of employment in health and life sciences)
- Medtech manufacture employment is concentrated in Sunderland and Newcastle, 200 and 175 employments
Read MoreEnergy - Employments by Local Authority and subsector (2020)Data information: Data is for the North East LEP area by each of seven Local Authorities within the LEP's boundaries. Employments includes employees plus the number of working owners. The BRES therefore includes self-employed workers as long as they are registered for VAT or Pay-As-You-Earn (PAYE) schemes. Self employed people not registered for these, along with HM Forces and Government Supported trainees, are excluded. Employments in the energy area have been defined using 5 digit SIC codes selected by the North East LEP. Subsector totals may not sum correctly due to rounding. - In 2020 there were 23,000 individuals in employment in the energy area across the North East LEP
- Sunderland had the most employments in the Energy (5,000), followed by County Durham (4,500) and Newcastle (3,500)
- The majority of employment in this sector in Sunderland was in gas & electricity (3,500), 69% of energy employment in Sunderland
- The largest subsector in County Durham was manufacturing energy sector apparatus (2000), by which accounted for 45% of employment in energy in Durham
- The biggest subsector in Newcastle was engineering activities 1,250, which accounted for 63% of employment in sector in Durham
Read MoreDigital - Employments by Local Authority and subsector (2020)Data information: Data is for the North East LEP area by each of seven Local Authorities within the LEP's boundaries. Employments includes employees plus the number of working owners. The BRES therefore includes self-employed workers as long as they are registered for VAT or Pay-As-You-Earn (PAYE) schemes. Self employed people not registered for these, along with HM Forces and Government Supported trainees, are excluded. Employments in the digital area have been defined using 5 digit SIC codes selected by the North East LEP. Subsector totals may not sum correctly due to rounding. - In 2020 there were 26,000 individuals in employment in the digital tech across the North East LEP.
- 10,000 of these were employed in Newcastle upon Tyne, and a further 6,000 were employed in North Tyneside
- A majority of the employment in Newcastle upon Tyne was in Software development, which accounted for 6,000 employments and 60% of employment in the sector in Newcastle upon Tyne
- North Tyneside had more of a focus on Digital telecoms, which accounted for 3,500 employments and 61% of the total in North Tyneside
- County Durham had the most individuals employed in the manufacture of electronic equipment (1,000)
Read MoreKnowledge intensive business services - Employments by local authority and sub-sector (2020)Data information: Data is for the North East LEP area by each of seven Local Authorities within the LEP's boundaries. Employments include employees plus the number of working owners. The BRES therefore includes self-employed workers as long as they are registered for VAT or Pay-As-You-Earn (PAYE) schemes. Self employed people not registered for these, along with HM Forces and Government Supported trainees, are excluded. Employments in the health and life sciences area have been defined using 5 digit SIC codes selected by the North East LEP. Subsector totals may not sum correctly due to rounding. - In 2020 there were a total of 80,000 employments in knowledge intensive business services in the North East LEP. Of these employments 29,000 were located in Newcastle upon Tyne
- The three biggest subsectors in Newcastle were Finance and insurance, Software development and Legal and accounting. Each of these contained 6,000 employments and 20% of employment in this sector in Newcastle
Read More
TradeNorth East goods exports increased by 5% in Q4 2021, but exports for 2021 overall were 12% below exports in 2019. Relative to 2014, North East export levels are lower than all comparator regions. Exporters are distributed across the North East LEP, with ports and other infrastructure providing connections to international markets. Road vehicles exports have seen a 42% decrease since Covid-19. Other commodities have grown by 2%. Exports to Germany have seen the largest increase since 2019, and Germany is now the North East’s largest market. Service exports from the North East have improved recently, but to the EU fell in 2019, following a national trend. Exports of goods (value £m), North East region, quarterly from 2014- North East goods exports increased by 5% (+130M) in Q4 2021, the first quarterly increase in 2021
- Overall exports in 2021 were nearly the same value as in 2020 and 12% lower than in 2019
- Exports increased to both EU and Non-EU markets in Q4, by 4% and 6% respectively
- Total exports in 2021 to the EU were 15% lower than 2019. Exports to Non-EU markets were 7% lower
Read MoreExports of goods index (2014 value = 100), North East region and comparisons, quarterlyData information: Based on English regional data. The North East region contains the North East and Tees Valley LEP area. The Northern Powerhouse is a combination of three regions: North East, North West and Yorkshire and the Humber. The base for the index is the quarterly average for 2014. - The North East quarterly change in Q4 (5%) was the lowest of all English regions and below the Northern Powerhouse (9%) and England excluding London (13%)
- Total North East exports in 2021 were 12% lower than 2019. They were 2% lower for the Northern Powerhouse and 9% lower for England excluding London
- The North East’s export index is well below 2014 levels and looks to have separated from the Northern Powerhouse index since 2020
Read MoreNorth East exports change by commodity (2019-2021)Source: Regional Trade Data (UK Tradeinfo / HMRC, last updated 7 April 2022). North East LEP calculations. Data information: 20 largest commodity groups - Road vehicles exports have declined by £1772M over two years. Exports of commodities other than Road vehicles have increased 209M (2%)
- In percentage terms the three largest declines amongst these commodities were Paper (58%), Oils and perfumes (56%) and Road vehicles (42%)
- The three largest increases were Ores and metal scrap (48%), Non-ferrous metals (44%) and Pharma (25%)
Read MoreNorth East exports change by market (2019-2021)Source: Regional Trade Data (UK Tradeinfo / HMRC, last updated 7 April 2022). North East LEP calculations. Data information: 25 largest North East markets In percentage terms the largest increases amongst these markets were to South Korea (49%), France (29%) and Austria (26%). Germany was 4th on 21% The Netherlands saw the largest absolute decline and fell from the North East’s largest to third largest market The biggest declines in percentage terms were to Spain (48%), Belgium (37%) and Poland (35%). The Netherlands was 6th on 33%
Read MoreTotal volume of goods passing through North East LEP Ports (2000-2020)- 69% of goods passed through North East LEP ports passed through the Port of Tyne in 2020, 14% through the Port of Sunderland and 8% through the Port of Blyth. The final 9% passed through other ports
- The total volume of goods passing through North East LEP ports has peaked twice prior to Covid-19. Once prior to the 2008 recession and again in 2013. The volume had started rising again from a low-point in 2017 prior to Covid-19
- The decline in volume since 2013 has been caused by falling exports volumes (-53%). The volume of imports has increased 9% since 2013
- The volume of goods passing through Newcastle has declined by 53% since 2013, while the volume passing through Sunderland has increased by 32%. Blyth saw a decrease of 22%
- 34% of imports through Newcastle in 2020 were classed as ‘other dry bulk’, 13% of exports were road vehicles
- 23% of imports through Sunderland were classed as Iron and Steel, and 44% of exports were classed as other dry bulk. There is no commodity data available for other ports
Read MoreService exports index North East and comparators (2017 = 100)Source: Subnational trade in services (ONS last updated 5 November 2021). North East LEP calculations. Data information: The North East region contains the North East and Tees Valley LEP area. This graph combines data from three releases (2017-2019).
Read MoreNorth East service exports by industry 2019 (£Millions)Source: Subnational trade in services (ONS last updated 5 November 2021) Data information: The North East region contains the North East and Tees Valley LEP area.
Read More
Recruitment and jobsRelative to before Covid-19 levels of job adverts in the North East have increased more quickly than in England. North East businesses are finding it more difficult to fill vacancies due to low application numbers and a lack of qualified applicants. The North East region has a low share of ‘better jobs’ and degree educated workers across all sectors, although the region was seeing strong growth in more and better jobs until the onset of Covid-19. Prior to Covid-19 employment in the North East LEP was projected to increase by 15,000 from 2017 to 2027, with the largest increases projected to be in Health and social work; professional services; support services and information technology. Vacancies index since February 2020, North East region and EnglandSource: Online Job Advert Estimates [ONS, up to and including 27 Jan 2023] Data information: These indices are based upon job adverts provided by Adzuna. This data includes information on several million job advert entries each month.
These are experimental statistics, subject to revisions as methodology and systems are refined. The latest job advert totals are indexed in comparison with vacancy totals in February 2020.
Based on the North East region, which includes the North East and Tees Valley LEP areas. - In the first week of April job adverts in the North East region were at 165% of Feb 2020 levels, while in England overall they were only at 132%
- The North East may be starting from a lower base of total job adverts. A report from the Institute of Employment Studies (IES) indicated that the North East region had the lowest number of vacancies per working age resident among the nine English regions in June 2021
- Higher numbers of job adverts in the region may also reflect that fact economic inactivity has increased since Covid-19, meaning adverts are less likely to be filled
- The economic inactivity rate in the North East LEP increased by 2.2% in the year to Dec 21-Feb 22, a much larger increase than in England as a whole (0.2%)
Read MoreVacancy filling compared with normal for the time of year (%), North East region, Feb 2022Source: Business insights and impact on the UK economy Data information: The question in full was: How does your business's ability to fill vacancies in the last month compare with normal expectations for this time of year? The percentage is of businesses not permanently stopped trading, 24 January 2022 to 20 February 2022. Businesses could cite more than one reason. The labels are rounded to the nearest whole percentage but the bars are not.
Read MoreReasons for difficult to fill vacancies (%), North East Region, Feb 2022
Read MoreProportion of ‘better jobs’ by region and sector (2018-2020)- The North East region has a relatively small portion of the workforce employed in ‘better jobs’, defined as managerial; professional; associate professional and technical occupations
- The North East has a high proportion of the workforce employed in sectors with low numbers of these occupations. However, the proportion of better jobs within all sectors except education was lower in the North East region that England excluding London too
- This demonstrates that the relatively low share of ‘better jobs’ in the North East region is not purely a result of the North East’s sectoral composition
- The gap in better jobs share is especially large in financial intermediation (20%), but is also high in real estate and associated activities (11%), public administration and defence (10%), energy (10%) and manufacturing (9%)
Read MoreProportion of workforce with a degree level qualification (2018-2020)
Read MorePercentage of staff not fully proficient, 2017 and 2019 North East LEP areaSource: Employer Skills Survey (DfE) 2019 Data information: The survey was undertaken before the start of COVID; Under-utilised staff are those that have both qualifications and skills that are more advanced than required for their current job role. The figures on the bar segments are the rounded percentages of all establishments in each category. The figures in the legend are the percentage of staff in the establishment that are under-utilised. There are some sectors where a high The latest available data is for 2019, prior to the COVID pandemic. In that year in the North East LEP area, 4.04% of workers were identified as not fully proficient. This was a slightly lower percentage than in 2017, when it was 4.10%, and it was lower than the England equivalent (4.58%).
Read MoreEstablishments by proportion of under-utilised staff (% of total), 2019 North East LEP areaSource: Employer Skills Survey (DfE) 2019 Data information: The survey was undertaken before the start of COVID; Under-utilised staff are those that have both qualifications and skills that are more advanced than required for their current job role. The figures on the bar segments are the rounded percentages of all establishments in each category. The figures in the legend are the percentage of staff in the establishment that are under-utilised. - About 39% of establishments in the North East LEP area identified that they had under-utilised workers in 2019. This was five percentage points higher than nationally
- About 19% of North East establishments had 50% or more under-utilised workers, including 7% where all workers were under-utilised. Both proportions were larger than for England (16% and 6%, respectively)
Read MoreEmployment in all occupations in the North East LEP area since 2014Source: Annual Population Survey – Workplace Analysis (ONS via Nomis, last updated 16 Apr 2024, next update 18 Jul) Data information: Based on the North East LEP area.
Read MoreEmployment in ‘better job’ occupations in the North East LEP area since 2014Source: Annual Population Survey - Workplace Analysis, (ONS via Nomis, last updated 16 Apr 2024, next update 18 Jul) Data information: "Better job" occupations defined as those in three broad occupation groups: managerial; professional; and associate professional and technical. Geography: North East LEP area
Read MoreProjected North East employment changes (000s) by broad industry group, 2017 – 2027Source: Working Futures Data information: Working Futures 2017-2027 is an assessment of employment prospects in the UK national and local labour markets over a 10 year period. It is made up projections prepared in late 2019 and early 2020 and does not, therefore, take account of the economic impact of COVID - In the North East LEP area, it was projected that total employment would increase by about 15,000 between 2017 and 2027. The projections include an estimated requirement of additional employment of 292,000 to replace workers leaving the labour market during the period and, therefore, a total employment requirement of 307,000 over the 10 year period
- Among six broad sectors, the largest total requirement for the period was projected to be about 105,000 in non-marketed services such as health and social work, education and public administration. Most of the remaining projected requirement was in business and other (personal) services (90,000) and in retail, wholesale, accommodation, food services and transport (76,000)
Read More
InnovationThe North East LEP has a relatviely high proportion of innovation actvie businesses. 42% of North East LEP businesses were innovation active in 2016-2018, a higher share than those in England (38%). In contrast overall R&D spend in the North East region per head is -£386 lower than in England excluding London. R&D spend has grown more quickly in the North East region than England excluding London since 2014 (35% vs 27%), but it fell 5% between 2018 and 2019. The North East also has a lower number of patents applied for, published and granted than England excluding London. 31 applications were granted per million adults compared to 83 in England excluding London in 2020. R&D expenditure by sector (£ per adult), UK nations and English regionsSource: Gross domestic expenditure on research and development, UK (ONS; last updated 4 Aug 2021) Data information: Expenditure rate is £m per 10,000 adults. Based on UK nations and English regions - the North East region includes the North East and Tees Valley LEP areas. Northern Powerhouse regions are the North East, North West and Yorkshire and the Humber regions. The "greater South East" is made up of three regions: London and the South East and East of England. Adult population is all people age 16 and over (mid-2019 estimates)
Read MorePatents per million adults, English regionsData information: The North East region includes the North East and the Tees Valley LEP areas. The rate of registration is expressed per million resident adults in the area (North East LEP calculations using ONS population estimates).
Read MoreTrade marks per million adults, English regionsData information: The North East region includes the North East and the Tees Valley LEP areas. The rate of registration is expressed per million resident adults in the area (North East LEP calculations using ONS population estimates).
Read MoreDesigns per million adults, English regionsData information: The North East region includes the North East and the Tees Valley LEP areas. The rate of registration is expressed per million resident adults in the area (North East LEP calculations using ONS population estimates).
Read MoreHighly innovative firms in the North East LEP by locationSource: The Data City Data information: The Data City uses an experimental methodology to assess the likelihood a company is innovation active using the company’s website text. Highly innovative businesses have received the maximum three star score. - 120 companies in the North East LEP area were identified as being highly innovative, receiving the maximum three star score
- These companies are more likely to be located in Newcastle than the other companies in the North East LEP. Newcastle is the only North East local authority that has a positive location quotient for highly innovative businesses
- Information and communication was by far the most common high level sector for highly innovative businesses in the North East LEP (29%), followed by professional, scientific and technical activities (16%) and human health activities (13%)
Read More
Evidence review on 'what works'As part of the development of regional UKSPF evidence base, an evidence review was completed, compiling the below list of links to policy evaluations and evidence reviews aligned with the UKSPF investment themes. This summary and analysis can be found here. |