Environmental protection

The North East contains major urban conurbations but also includes some of the most remote rural areas in England. It has many protected areas, which include nationally important habitats, species and geology. A key task is to monitor the impact of climate change on these areas and on North East air and water quality, flood risk areas, temperature and rainfall.

NOTE: This page was created for the launch of Net Zero North East England in 2022. The content has not been updated since that date. The Net Zero theme page has links to more up to date evidence.

5.9%

of England's land area
is in the North East

8%

of England's forested areas
are in the North East

Almost a third

of the North East LEP area
is in a National park or AONB

3% of the North East

is at high risk
of flooding

+1.2°C

higher North East average temperature
than 50 years earlier 

Land Use

The area of the North East is about 786,000 hectares (ha), about 5.9% of the total area of England. In 2018, the latest available data, there was almost 46,000 ha of developed land, just over 739,000 ha of non-developed land and a small amount of land of unidentified type.  About 6% of non-developed land in England was in the North East, compared to just  over 4% of developed land. In particular, the North East contained, respectively, over 17%, 16% and 8% of England's rough grassland, natural land and forested areas.

In the latest data, the North East LEP area had a lower percentage of developed land than England, the lowest among the eight core city LEP areas. This is due to the inclusion of Northumberland and County Durham, which both have large areas of non-developed land. The rest of the North East, Tyne and Wear, had a higher percentage of developed land than all core city LEP areas, four of which are also former metroplitan counties. Almost half of North East land was used for agriculture in 2018, but this was a lower percentage than that for England (almost two thirds). More than two fifths of North East land was forestry and woodland, natural land and rough grassland, and this was twice the proportion for England.

Among the core city LEP areas, the North East had the highest proportion of developed land used for transport and utilities and the lowest proportions used for industry and commerce and for residential purposes. It also had the second lowest proportion used for community and defence buildings.  Within the North East, the highest proportions of developed land used for transport and utilities were in Northumberland and County Durham, while Gateshead and Sunderland had the highest proportions used for industry and commerce. Residential purposes made up a higher proportion in North and South Tyneside than elsewhere in the North East. The Evidence Hub includes further data in a specific land use data page.

The latest local data about the previous use of new residential addresses covers 2015-18. This dataset shows, in this period, that five of the seven North East local authority areas had percentages of new addresses built on previously developed land that were similar or higher than the England rate (56%), with Newcastle having the highest (68%).  The two exceptions were Northumberland (20%) and South Tyneside (47%). Northumberland had a particularly large percentage of new addresses on previously non-developed agricultural land.

New residences on previously developed land, North East local authority areas, 2015-18

New residences on previously non-developed land, North East local authority areas, 2015-18


Environmental designations

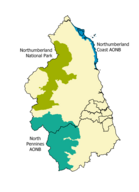
According to ONS estimates and definitions, in 2020, the North East LEP area included the seventh and eighteenth most populous built up areas in England: Tyneside and Sunderland, respectively. Despite containing these conurbations, the North East LEP area contains many areas of environmental importance, which have been designated to reflect their national significance. National Parks and Areas of Outstanding Natural Beauty (AONBs) are the largest and most high profile of these areas. Almost 32% of the area of the North East LEP is within a National Park or AONB.

Northumberland National Park is the most northerly of the ten in England and is also the most sparsely populated. It was designated in 1956, about five years after the Peak District was designated the first English National Park. It is entirely within Northumberland and makes up about 13% of the North East LEP area and about 21% of the area of Northumberland.

As well as two AONBs and a National Park, the North East LEP area also includes all or part of:

  • Fifteen National Nature Reserves (NNRs), established to protect important habitats, species and geology and all within either Northumberland or County Durham
  • five Ramsar sites, internationally designated important wetlands, the largest of which covers Lindisfarne.
  • over 230 Sites of Special Scientific Interest (SSSIs) located across all seven local authority areas
  • almost 100 Local Nature Reserves (LNRs), designated by local authorities, with wildlife or geological features that are of special interest locally.

The North Pennines AONB is the second largest in England and is also a UNESCO global geopark. Only about two thirds of it is in the North East LEP area, with most of the rest in Cumbria. Despite this, it makes up 39% of the area of County Durham, about 9% of Northumberland's area and about 17% of the total North East LEP area.

The Northumberland Coast AONB is smaller, covering about 40 miles of the coastline as well as Lindisfarne and the Farne Islands. It makes up about 2.6% of Northumberland's total area and about 1.7% of the North East LEP area.

Many of these sites are within the AONBs and National Park but nearly 3% of the North East land area is within a protected area outside of these. This means that almost 35% of the North East is part of a protected area.

As a proportion of sites in England, the North East LEP area contains:

6.6%

of England's National Nature Reserves

7.0%

of England's Ramsar sites

7.5%

of England's Local Nature Reserves

5.5%

of England's SSSIs


Flood risk areas

The latest land use data from 2018 includes information about areas within National Flood Zone 3[1] and within areas of medium[2] and high[3] flood risk. At the time of the analysis, about 4.6% of the North East LEP area was within Flood Zone 3, with, taking account of defences, about 3.0% at high risk of flooding and 1.5% at medium risk. These percentages were each the third lowest among the eight core city LEP areas and much lower than the England equivalent. Within the North East, South Tyneside and Newcastle upon Tyne had the largest percentages of land at risk of flooding.

About 2.4% of the North East's developed land was in an area of high or medium risk of flooding, with 0.6% of residential sites and 2.6% of industry and commerce sites at risk. Again, these were much lower percentages than nationally.

  1. ^ Flood Zone 3 is an area with a more than 1 in 100 risk of flooding from rivers each year and/or a more than 1 in 200 risk of flooding from the sea. It does not take into account any flood defences
  2. ^ Medium risk means that each year this area has a chance of flooding of between 1% and 3.3%. This takes into account the effect of any flood defences in the area. 
  3. ^ High risk means that each year this area has a chance of flooding of greater than 3.3%. This takes into account the effect of any flood defences in the area.

Water quality

In 2021, Northumbria Water was classified as an industry leading company and given a star rating of four (out of four).  This rating reflected good performances in metrics relating to pollution, discharges and environmental planning. Only two other English water companies received a four star rating, with the remaining six receiving ratings of either one or two stars, indicating that they were either poor performing or required improvement.

A key metric contributing to the star rating was the rate of pollution incidents. In 2021, there were 69 such incidents in the Northumbrian Water area, the highest level since 2016. This was equivalent to 23 incidents per 10,000 km of sewer, lower than the England rate (32) and the fourth lowest among the nine major water companies. 

There are 25 designated bathing waters in the North East LEP area. In 2021, most (20) were classified as "excellent", with three classified as "good", one (Marsden) classified as "sufficient" and one other (Tynemouth Cullercoats) classified as "poor". The North East proportion of excellent bathing waters (80%) was higher than the England equivalent (71%).


Air quality

There are currently seven Air Quality Management Areas (AQMAs) in the North East LEP area, two each in County Durham, Newcastle and South Tyneside and one in Gateshead. These are areas that include places where the  national air quality objectives are unlikely to be met, according to a local authority review. In such a case, the local authority declares an AQMA and puts together a Local Air Quality Action Plan.

Annual air quality data provides information on the concentrations of major air pollutants, as measured by monitoring stations in the Automatic Urban and Rural Network (AURN). There are four such stations in the North East. Throughout the last decade, the concentration of nitrogen dioxide in Newcastle has continued to be higher than the national average, while it has been lower in Sunderland. For  particulate matter concentrations, the North East figures have generally been lower than national, while ozone concentration in Sunderland has been higher than for England as a whole..


Climate

Durham is one of the historic Met Office stations for which a long time series of monthly climate data is available. In Durham's case, this stretches back into the nineteenth century. The output includes temperature, rainfall and air frost data, each of which is volatile year on year and requires the use of twenty year averages to provide useful trend data.

Durham's average temperature in the 2002-2021 period was about 1.4°C  higher than in a hundred years earlier (1902-1921), with most of the net increase (+1.2°C) being added since 1952-1971. Looking at the latest 50 year change, January, February and March average temperatures in Durham have increased by slightly higher amounts than in other months, while the average annual number of days of air frost has decreased by more than a quarter.

Patterns of changes in rainfall are less clear cut, but the Durham 20 year averages are currently at their highest level since the start of the time series. Compared to fifty years earlier, Durham's average rainfall in 2002-2021 was particularly higher in June and July and in the final quarter of the year. It was lower in February, Mat and August.


Waste disposal 

The proportion of local authority collected waste that was recycled or composted in the North East LEP area has remained relatively stable over time. In 2014-15 this was 39% of local authority collected waste and in 2020-21 this was 35%. The proportion has been consistently lower than the proportion of waste recycled in England, which was 41% in 2020-21. The highest recycling rates were in Newcastle, County Durham and North Tyneside.