Real gross domestic product (GDP) per head shows a steady incline from 2009 followed by noticeable dip around 2020–2021, coinciding with the economic disruption caused by the COVID-19 pandemic. This is followed by a gradual recovery, indicating a rebound in economic output per person. The North East and England follow the same pattern.
Income and productivity
Gross Disposable Household Income
Gross Disposable Household Income (GDHI) is the amount of money households have left to spend or save after essential outgoings. GDHI in the North East grew by 9.6% in 2023 when compared with 2022; UK GDHI increased by 9.5%.
Lower than average GDHI per head
In 2023, the North East GDHI per head was £20,149, well below the UK equivalent (£24,836). It was the fourth lowest rate among the 15 English mayoral strategic authority areas, about £625 per head below the median value for these areas.
£35.97
North East GVA per hour (2023)
This measure of productivity was lower than the UK equivalent (£41.87) and was £8.67 higher than a decade earlier (2013).
GDHI per head comparisons
Trends in North East productivity (GVA per hour worked)
Gross Domestic Product
Business base
Business births and deaths
In 2024, the North East recorded 6,580 business births and 5,765 business deaths, with birth and death rates of 11.5% and 10.1%, respectively.
54,860
registered private sector businesses in the North East
In March 2025, there were 55,170 PAYE/VAT registered enterprises in the North East, with all but 310 being in the private sector.
12% growth over ten years in the number of private sector businesses
Between 2015 and 2025, the total number of VAT/PAYE registered private sector businesses in the North East increased by 5,930, with net growth of 470 (0.9%) increase in the latest year.
The North East has a relatively low number of businesses per head compared to other regions of the UK, largely due to the impact of a lower rates of business births. While the share of high-growth firms is in line with national averages, access to finance remains a constraint.
Small to medium sized enterprises (SMEs) are central to the economy, representing 99.9% of businesses, 67% of employment, and 60% of turnover, with a higher share of private sector jobs in SMEs than in large firms.

Sector Overview
In the North east, over 16% of the workforce are employed in the broad health and care sector. Other high employment sectors in the region include education, manufacturing, retail and hospitality. More than half of employees in retail, hospitality and arts work part-time.
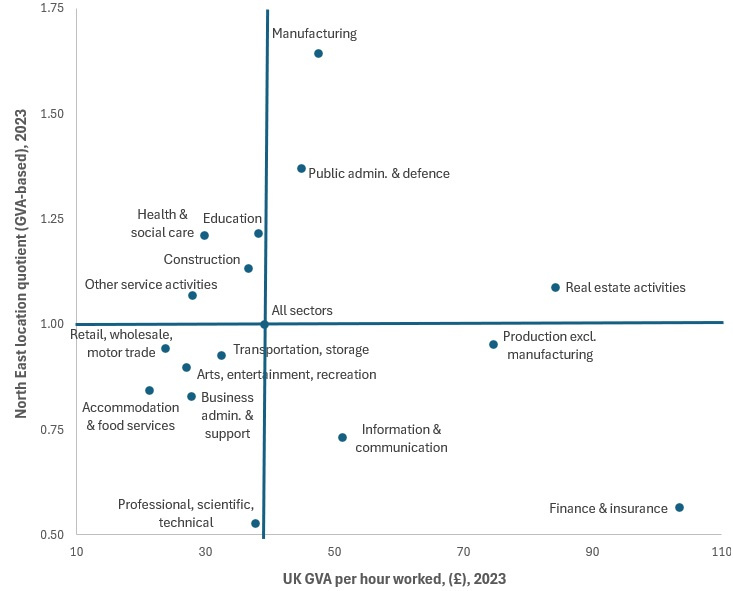
Location quotients reveal manufacturing and public administration as the most regionally significant sectors, both ranking high for productivity. In contrast, sectors with the highest productivity, finance, real estate and non-manufacturing production are less prominent locally.
Much of the North East economy is relies on lower productivity sectors
Key sectors
Sectors where the North East has economic strengths, assets and opportunities were identified.

Offshore wind and energy transition
Current state: Around 1,000 renewable energy companies have North East sites, with an estimated 25,000 staff.
Comparative advantage: 9% of the UK’s offshore wind businesses are located in the North East.
Recent / projected growth: Aim to grow the regional offshore wind workforce to 24,000 by 2035.

Advanced manufacturing including electric vehicles
Current state: 3,900 businesses in advanced manufacturing employing 67,000 people.
Comparative advantage: 44% of England’s employment in battery and accumulator manufacturing.
Recent / projected growth: Employment in battery and accumulator technology has more than doubled since 2015.

Creative industries and content
Current state: 50,000 jobs in the wider region’s creative industries.
Comparative advantage: Outside of South East England, 6.3% of jobs in screen sectors and 6.6% of music/visual arts.
Recent / projected growth: 67% jobs growth in the wider region’s creative industries in past decade. This is the fastest growing sector in the region in the last 10 years in the UK.

Life sciences, pharmaceuticals and process industries
Current state: 8,000 employed in life sciences in the North East MSA area.
Comparative advantage: Over 10% of England’s employment in pharma manufacturing – about 3,800.
Recent / projected growth: Value of pharma exports 2.4 times higher than a decade ago.

Tech, digital and AI
Current state: About 45,000 jobs in the wider region’s digital sector, with 8,400 employees in broad AI sectors.
Comparative advantage: 8.4% of UK employment in computer manufacturing outside the South East.
Recent / projected growth: 37% digital jobs growth in past decade; advanced digital skills are critical to all sectors.

Defence, security and space
Current state: One of the fast-growing space clusters.
Comparative advantage: One of the largest and longestestablished defence clusters, with links to space and digital.
Recent / projected growth: UK defence sector expected to grow by 50% over next five years.
Sectoral employment patterns
This set of maps illustrates how employment in key sectors is distributed across the region, highlighting both areas of concentration and wider patterns of economic activity. There is a clear urban dominance for creative, financial and professional services, which advanced manufacturing demonstrates a more region-wide footprint. Digital technologies, through concentrated, shows potential for growth beyond the urban core.
Employee numbers are mapped for selected growth-driving (IS-8) sectors, as defined in the UK's Modern Industrial Strategy 2025. The definition is based on an aggregation of subsectors in the UK's official Standard Industrial Classification (SIC), last updated in 2007.

R&D and innovation
The North East has one of the lowest overall R&D spend as a percentage of GDP in 2023, with a combined share below 2% of GDP. Business enterprise R&D forms the largest component, but it is modest compared to regions like East of England or South East. However, the North East stands out for its strong Higher Education R&D contribution at 0.85% of GDP, the highest among all regions, surpassing Yorkshire and the Humber at 0.69%. This indicates that universities and research institutions play a critical role in the region’s innovation activity, even though private sector and government investment remain limited.
Inward investment and trade
2,100
North East foreign direct investment (FDI) new jobs
3Y annual average: 3,100,
rate per head 60% above
England excl. London
rate in 2024/25.
7.0%
of English FDI new jobs outside London
were in the North East
in 2024/25.
44% of English FDI new jobs
were in London.
4.9%
of North East businesses exported goods
2023 (% of non-financial
private sector businesses).
Joint highest among the
nine English ITL1 regions.
4.9%
of North East businesses exported services
2023, lowest among the
nine English ITL1 regions.
8.9% exported goods
and/or services.
Economic market foresight analysis
In 2021, a regional economic markets foresight study was undertaken to provide an independent and objective assessment of the opportunities arising from new and emergent markets. This resulted in 16 market profiles which set out the global position, regional opportunity and interaction with wider global trends such as the green economy and an ageing population.
More of the Local Growth Plan Evidence Base

Introduction and context
This section offers an overview of our local assets, population and geography.

Our economy
📍 You are here
The economy brings together data on regional productivity, GDP, our key sectors and investment.

Our people
Our people covers evidence on the skills of our residents, the labour market, deprivation and quality of life.

Place
Place includes insight on the region's housing, climate, transport and tourism.