Creative Industries

Statistics on employment, business numbers, and GVA for the Creative Industries

Introduction

The Creative Industries are a vital and fast‑evolving part of the North East economy, contributing significantly to employment, business growth, and regional productivity. This evidence base brings together the latest data on the sector, offering a clear picture of its scale, structure, and economic impact across the region.

The creative economy in the North East spans a diverse range of activities—from publishing, broadcasting, design, and architecture to film production, advertising, cultural education, and digital services such as software and computer programming. Together, these industries reflect the region’s strengths in innovation, digital skills, and cultural production.

This page provides detailed insights into the sector’s employment trends, business landscape, and economic output (GVA), alongside spatial data illustrating where creative industry jobs are concentrated. By combining national datasets with local analysis, it supports a deeper understanding of how the sector is performing and where opportunities for future growth exist within the North East.

Defining the sector

The North East Local Growth Plan, published in March 2025, identifies advanced manufacturing as a sector where the North East has unique economic assets and opportunities. The UK's Modern Industrial Strategy, published in June 2025, includes it as one of the nation's eight growth-driving sectors (the 'IS8' sectors).

The UK Industrial Strategy's sector plan considers that advanced manufacturing has production processes that integrate advanced science and technology. It notes that examples of such activities can be found across the range of manufacturing, but defines a measurable proxy for advanced manufacturing based on subsectors. This uses the Eurostat and UN definition of high and medium-high technology manufacturing. There are seven broad manufacturing subsectors identified in this way (with the two digit UK SIC codes in brackets):

An image

Manufacture of jewellery and related articles (3212)

An image

Publishing activities (58)

An image

Motion picture, video and television programme production; sound recording and music publishing activities (59)

An image

Programme and broadcasting activities (60)

An image

Computer programming activities (6201)

An image

Computer consultancy activities (6202)

An image

Public relations and communication activities (7021)

An image

Architectural activities (7111)

An image

Advertising (731)

An image

Specialised design activities (741)

An image

Photographic activities (742)

An image

Translation and interpretation activities (743)

An image

Cultural education (8552)

An image

Creative, arts and entertainment (90)

An image

Library and archive activities (9101)

An image

Museum activities (9102)


North East employment

23,000 employment in creative industries

NE registered enterprises, 2024.
8,000 in Newcastle Upon Tyne.
other NE Local Authorities <4,000.

2.67%

of total employment

NE registered enterprises, 2024.
Below the proportion of employment in England of 5.03%.
North Tyneside has the highest proportion of employment at 4.49%.
Durham, Northumberland, South Tyneside, and Sunderland have <2%.

-0.60%

change in % of total employment

NE registered enterprises, 2024.
Change from 3.27% in 2023.
Proportion of employment increased in England
by 0.04% between 2023 and 2024.

-5,000

change in employment in creative industries

NE registered enterprises, 2024.
Change since 2023.
Returned to the 23,000 the same employment
as 2021 and 2022.
Employment in the sector grew across England by 20,000.


North East business count

3,495

creative industries businesses

NE registered enterprises, 2025.
Based on a single classification.
895 in Newcastle Upon Tyne.

92.7%

of creative industries enterprises micro-sized

NE registered enterprises, 2025.
Micro-sized enterprises have 0 to 9 employees.
GB, creative industries: 93.5%.
NE all sectors: 87.3%.

910 computer consultancy businesses

NE registered enterprises, 2025.
Based on a single classification.
An additional 465 businesses in
computer programming activities.

more broadly defined creative industries businesses

Based on Companies House data and
information from corporate websites.
Businesses can be in more than one sector.

Regional GVA data is not available for all SIC codes used previously to define the creative industries. The following GVA data uses a broader definition of the creative industries sector. Below are the subsectors used to make this proxy with the corresponding two-digit UK SIC codes in brackets:

An image

Publishing activities (58)

An image

Motion picture, video and TV programme production (59)

An image

Programming and broadcasting activities (60)

An image

Computer programming and consultancy (62)

An image

Advertising and market research (73)

An image

Creative, arts and entertainment activities (90)


Economic output (GVA)

£2.1 bn

North East creative industries GVA

2023 estimate,
2.3% of total GVA in North East CA,
Compared to 3.3% of total GVA
across the UK (excl. London).

1.92%

of UK's (excl. London) creative industries GVA

North East CA, 2023,
71.6% of North East CA's 
creative industries GVA from
computer programming and consultancy.
 

+17.9%

five year change in creative industries real GVA

North East CA, 2018-23.
Compared to a 3.6% increase
across UK (excl. London)
Real totals, exc. inflation effects.

+39.1% five year change in computer programming and consultancy real GVA

North East CA, 2018-23.
Compared to a -14.5% fall in real GVA
across other creative industries in North East CA.
Real totals, exc. inflation effects.


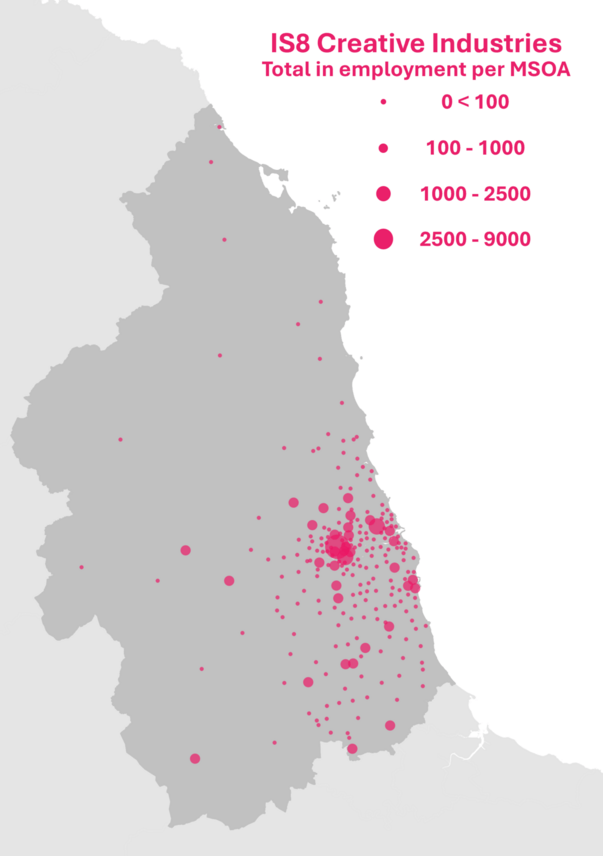
Employment location map

This map is based on information from the 2024 ONS Business Register Employment Survey (BRES), the official government source of employee statistics by industry.

The map shows estimated employment totals in creative industries PAYE/VAT registered businesses.

The geography used is the North East's 253 middle layer super outrput areas (MSOAs). These areas are designed to be approximately equal in population size and to be consistent over time in a way that council wards are not.

Employment in this dataset includes employees and working proprietors. The published employment totals are rounded to the nearest five.

Each business is classified in a single industrial sector. The source of broader, overlapping, classifications (Data City) does not yet have useable local employment estimates.

  Creative industries map